Forex Daily Signals

Trade Setup For 1st August

Here Are My Zones For August

Resistance

1271.25-1272.25
1278-1279
1284.50-1285.50
1290.50-1291.50

Support

1264.25-1263.25
1257.50-1256.50
1250.50-1249.50
1242-1241

I am not trading today as I want to take some time away to get things together.
Zemanta Pixie

Trade Setup for July 31st

Here are the zones I am watching for July 31st

Resistance

1285.75-1286.75
1290.50-1291.50
1300.50-1301.50
1308.50-1309.75

Support

1280-1279
1274.25-1273.25
1264.25-1263.25
1257.50-1256.50

My Outlook

Nothing has really changed since yesterday in my outlook. Oil bounced yesterday which could shake up the market a bit though it didn't do so yesterday. Apart from that though there is nothing to update on.

My Focus


Currently we are trading at the 1282 area in the overnight market. The pivotal area on the upside for tomorrow is the 1291 area. It is the previous high in the market. I do suspect we can break it from the looks of this run up so far but not sure if it will happen tomorrow. If we show significant weakness up there I will look for some form of pullback.

On the bottom end we have 1274 which is the pivotal support area. If we reach down there I would be looking for some strong buying to come in to help prop the market over the 1291 area. I think it will be important to see which one is met first, 1291 or 1274. If we hit 1291 and retrace first, its not a good sign for the buyers. However if we reach 1274 and bounce, it could be a nice set up for a new high.

I have become concerned about trending days recently. They seem to catch me out because I am limiting myself to only s/r trades. Now I prefer trading at s/r levels however on trending days it is rare to see the market use the s/r levels in the direction of the trend for pullbacks.

I do have other ways of trading but recently have been limiting myself to purely s/r levels. I define strongly trending days by the action of the Tick. Like we saw on Tuesday the market wasn't interested in any extended selling. At least for the entire morning.

Now my way of trading these trending days has been using the Fast and Slow EMA's on my 5 minute chart. They commonly are a form of moving support or resistance in trend days. You can see the way it rides the fast EMA on the Tuesday.

So when a trend day is identified via the Tick action being rather one sided, and the EMA being already respected once and following roughly a 45 degree angle, I will use that as a moving s/r in the direction of the trend. This can help me stay on the right side of the market instead of looking for the opposite move simply because I want to trade.

I am still taking my casual approach as seen in the journal with my decrease in number of entries. Trades will be at the s/r levels, either fixed or moving s/r depending on the type of day. Stops will be hidden behind strong market areas and initial profit targets will be placed in easy to reach spots. The second position will be trailed should the first target be taken.
Zemanta Pixie

Trading for 31 July

USD/JPY
Sell Stop 107.70 TP 107.50 SL 107.90
Buy Stop 108.70 TP 108.90 SL 108.50
GPB/USD
Sell Stop 1.9760 TP 1.9730 SL 1.9790
Buy Stop 1.9910 TP 1.9940 SL 1.9880
GBP/JPY
Sell Stop 213.50 TP 213.00 SL 214.00
Buy Stop 214.50 TP 215.00 SL 214.00

Trade Setup For 30th July

Usd/Jpy

Buy Stop 108.65 TP 108.85 SL 108.45
Sell Stop 107.70 TP 107.50 SL 107.90

Gbp/Usd

Sell Stop 1.9760 TP 1.9730 SL 1.9790
Buy Stop 1.9910 TP 1.9940 SL 1.9880

Gbp/Jpy

Sell Stop 213.50 TP 213.00 SL 214.00
Buy Stop 214.50 TP 215.00 SL 214.00

Trade Setup For 30th July

Here are my zones I'm watching for the 30th July

Resistance

1262-1263
1269.25-1270.25
1277.25-1278.50
1285.75-1286.75

Support

1257.50-1256.50
1250.50-1249.50
1242-1241
1233.50-1232.25

My Outlook

Well we certainly threw a curve ball yesterday as Oil fueled the market into a nice gain. It is in fact enough to have me assessing this as a 1-2-3 bottom for the moment.

The VIX has made a similar pattern as the indexes but just in reverse. We now appear as though the volatility and put option interest is ready for a decline.

Oil and Gold made a surprising decline as I thought we would at least make a small bounce. At this point I will go with the flow but Oil does seem to be impacting the indexes pretty heavily lately.

The USD made some further gains yesterday which is also adding weight to the stocks making a run higher at this point. As always though I will take things with a grain of salt as each day occurs.

My Focus

We are currently trading at the 1261 area in the overnight market. As my bias is slightly bullish at this point, I would like to see a small retracement from the market prior to making possible further gains. Ideally we would see some reluctance to sell off past the 1257 area however a retest might be warranted down at the 1250 area. If either of those are met with volume and/or tick extremes or divergences, then I will look for some further gains to the upside.

If we gap above the 1263 area at the open, I would be looking for some signs of weakness to hit at the 1270 area. I wouldn't put too much weight behind a move down from there as a trend reversal though. If I do enter short up there I will keep the trade on a pretty tight leash and be ready for a trend continuation should we show signs of doing so.

For me the focus is going to remain on doing my best to trade only at the s/r levels. As much fun as riding a bucking bull is by trading everything under the sun, yeah right, I want to get my game back on track.

There is only a few ticks of lenience I am giving my s/r levels. Yesterday I made some decisions to trade in the middle of s/r zones which I would like to refrain from doing today. I am going to continue keeping tight stops behind strong areas and place my initial profit target in easy to reach areas. Trailing the second position as usual. Again, I'm going to take the casual approach to my trading but remember to only trade at the s/r zones.

Zemanta Pixie

Trading for 29th July

Here is my journal for the 29th July

Today we have the Consumer Confidence Index being released at 10am. So around that time I will try to remain pretty cautious of entering any new trades. Otherwise the rest of the day the market will be left alone from the influence of news. Right now we are trading at the 1240 area.

I will be looking for some possible weakness at the 1243.50 area through the Tick and/or volume. If we break that level I will test longs but still remain cautious with them beneath the 1251 area. Again I am not too confident in any longs beneath the 1251 area but should we show good signs of a reversal down at 1233 I will look at testing the long side.

9:50 We haven't really gone far from the open at this stage. Right now I suspect the news will need to hit before we decided to pick a direction at this point, if we pick one at all. Volume has been high as we moved marginally lower but is now tapering off on the 2 minute. The Tick has remained strong sticking above the zero line pretty well at this stage. Being so early there are no clear signs to me right now with either side. At this point I sit on the sidelines and wait until after the news hits. The safest way to be at this stage.

10:07 I entered short at 1245.75 with my stop at 1247. It was based on a push on news above resistance with a Tick extreme on big volume. We hung around the 1246 for a little bit of time but then pushed higher. I kept a relatively tight stop so I'm not too fussed. It wasn't following the plan exactly but I made the attempt. Next trade I will try to make it closer to the plan. The tick is showing strength sticking above the zero line and volume has supported the higher move at this point.

10:30 Hmm out for a loss again on the short side. I entered at 1247 with my stop at 1248.25 and my stop was hit. I wasn't at a resistance level again. I am trading the failure to push higher after the volume extreme and Tick extremes. Right now I am going to trade better if I stick to the plan. Volume has tapered off on this move sideways and the Tick hasn't made any strong moves beneath the zero area. This market is up so I am best working with that.

10:56 I'm in short at 1248.25 with my stop at 1249.50. Reason being the resistance area hit with a divergence on the Tick and lower volume on the second push higher. I just took my trade off for a tick gain as we weren't pushing beyond the zero area on the Tick. It was a risky trade and I wasn't willing to give it much space. This Tick has been showing stocks holding up like a mofo. Yet somehow I still would like to short the market.

11:23 I am definitely best leaving this market alone today. I have made some less than ideal trading decisions. I just shorted the market again at 1247.25 with my stop at 1248.50. The idea was a 1-2-3 top with the Tick moving into the negative for the first time today. Volume had also tapered off on the move. I'm going to call it a night right here and work on improving tomorrow. Considering I did many things that were not in my plan tonight I think I have come out pretty well. I do believe I have moved back into the short trading problems I had previously.

11:29 Well I just took another short trade for a point loss. Impulse trade mania. I'm closing my platform right now.

Daily Wrap Up

Wow is all I can say. I seemed to be on holiday last night whilst someone else took over and traded my account. I honestly am a bit confused as to where some of my decisions came from. Of 5 trades, really only one of them was according to my plan. It was the third trade which was a move from the 1251 resistance area with a divergence in the tick and declining volume.

Beyond that one trade at the resistance, I would have liked my focus to be turned to trading the long side. I'm not sure there is much I can say beyond recognizing the fact that most of my trades today were impulse based trades. This seems to be a recurring problem I face with my short trades. Not wanting to miss out on what is a "sure thing" move has me entering some short trades that don't exist or too early if they do exist.

The good part of today was that even though I took 4 out of 5 hits, I haven't taken a massive hit in my account. I much rather take the trades and lose so I have something to learn from rather than not trade and wonder what would have been. There is some learning to be done from today so I will accept the way I traded. It doesn't make me a bad trader, I just made some bad trades.

Today for following my focus I am giving myself an 'F'. The saving grace was that I did take a good trade at the resistance area even though it didn't pan out. It was the one trade that was in my plan and I did take it.

Trade 1a: 1.25 Loss
Trade 1b: 1.25 Loss
Trade 2a: 1.25 Loss
Trade 2b: 1.25 Loss
Trade 3a: 0.25 Win
Trade 3b: 0.25 Win
Trade 4a: 0.5 Loss
Trade 4b: 0.5 Loss
Trade 5a: 1.0 Loss
Trade 5b: 1.0 Loss
Zemanta Pixie

Trade Setup for 29th July

Here are the zones I'm watching for the 29th July:

Resistance

1243-1244.25
1250.50-1251.50
1262-1263
1269.25-1270.25


Support

1233.50-1232.25
1222.25-1221.25
1214.25-1212.75
1202-1200.50

My Outlook

The indexes all made a break lower yesterday with some decent force. Not much really to say which wouldn't be repeating myself from yesterday on that front. I'm still holding my slight bearish bias.

Ok my VIX data is no longer showing the massive upward candle it had on the 15th July. If that is the case then things change a bit. I thought that would have made it more acceptable to run higher but now its not exactly the case. Today we had a move higher. Again I would just be repeating myself now.

Gold and Oil are still pretty much the same. Nothing really to comment there. The USD is testing its recent strength so how far it tests will be interesting. I'm not convinced it is going to continue its decline into new lows.

My Focus

The market currently is trading at the 1234.50 area in the overnight market. I am being open to the market taking a breather after yesterdays strong selling. The 1243.50 area is the pivotal point for me today. If we reach there and can't show some strong buying I will look for a turn back down, possibly to make new lows.

If we gap above there at the open we could see some decent buying enter the market so we could see some strength hit at that area. If thats the case I will look to join the buyers. I'm not sure how strong 1233 will hold up as support so I will only trade long there if we have some strong buying occur evidenced by the Tick and volume.

I'm still taking my casual approach as placing less pressure upon myself is helping me trade. I am only trading at the s/r levels with stops hidden behind strong areas and initial targets in easy to reach places. The second lot will be trailed should the first lot be taken.

Trading for 28th July

Here is my journal from the 28th July

Today we have no major news releases so we are left to continue on from Friday. We are currently at the 1254 area and look to open in the 1250-60 congestion area. I am skeptical of any trades in this area so unless there are some clear signs for a short at the 1258 area I will avoid it. Otherwise long trades will be in play above the 1263 area. I am taking the casual approach again this week.

9:45 We have pressed above the 1258 resistance area and showed some hesitation. The Tick and volume didn't give any clear signs of reversal so I stuck on the sidelines watching. I don't like this area in here so I am going to let it pass me by and wait for some less congested price areas to deal with. The Tick is showing some pretty positive action by stocks at this point and volume moved up pretty well when the market moved higher.

10:15 Having a hard time staying awake at this point. Market action is in the 1256-60 area which I am avoiding as it is too messy for me. Volume has been declining from the open which tells me either we don't like higher prices or we simply aren't willing to commit to anything in this area. the Tick has been making higher lows showing an increase in buying interest at this point but its hardly been strong on the upside from where I'm sitting.

10:49 We have moved down from the 1260 area to roughly 1254. This is not really a market suited to my trading so for now I sit on the sidelines waiting. The Tick has begun expanding a bit which is a good sign for some loosening up of this market. Volume is still pretty light which confirms for me that traders are hesitant to enter this area on the market with force. We have made a possible double bottom in the market though it doesn't appear very strong in the sentiment department.

11:48 We have spent the last hour moving down without a good chance for entry on the short side. I guess this means today will be a sidelines day. The Tick has moved into negative territory and refrained from hitting the positive area strongly. Volume is still pretty light on the day though at the extension of this downward leg we are seeing growing interest as seen by volume. Possibly gearing up for some sort of bounce?

12:13 Bed time. This market left the station without me and wasn't pleasant enough to offer me a solid entry point. No worries. I am happy that I stuck to the plan by staying on the sidelines as my plan wasn't suited to the days market.

Daily Wrap Up

Today was a good display of keeping out of a market that doesn't suit my style. After some initial buying at the open we turned at the 1260 area and became a trend down day. Being that we were still in the 1250-60 mess area I chose to stay on the sidelines.

The market took its time breaking the 1250 area and then I was unable to find an entry beyond there. That being said, I am happy with my performance today. I stuck to my plan very well, I was looking for a possible short at 1258 but we extended beyond to 1260. There wasn't any strong tick or volume extremes so I hung back.

These strong trend days are not suited to my trading unless I get on early. I do have guides in my plan to take them but right now I am sticking to the s/r levels mainly. For following my focus I am giving myself an 'A'. No trades today but I followed the plan.

On another positive note, the bugs seem to be fixed with the latest update of my trading platform which is good news.

Trade Setup For July 28th

Here are the zones I am watching for July 28th:

Resistance

1256-1257
1262.75-1263.75
1269.25-1270.25
1277.25-1278.50

Support

1251.50-1250.50
1246-1245
1240.25-1239.50
1233.50-1232.25

My Outlook

At this point my view is neutral with a slight bearish bias. The charts are showing some downward mannerisms though the 1250 area has stopped the SP in its tracks twice now. I am still waiting to see if we continue the move into lower lows or if we find support prior to reaching the previous low. Until it becomes more evident I wouldn't want to put too much weight on either side.

The VIX appears as though it could be gearing for another run higher. The way it is looking, the put option demand is in a position to increase largely. It could go either way though so I will keep my eyes on it this week.

The equities saving grace last week was the decline of Oil and Gold. It has a long way to go if we are expected to use it as a step to bringing stocks back up to scratch. We could possibly see Oil make another move upward which runs out of steam prior to reaching its highs. This could lead the stocks to new lows and present what I might consider a selling extreme. Should that be the case, I would then look for signs of a bottoming market more closely. At the same time Gold would also need to show a decline as the USD possibly strengthens as traders move away from the safe haven.

The USD does appear to be getting some balls back. Against the AUD we have seen it gain hardly any ground since late May. Against the JPY it has been gaining steadily since March this year. Against the EUR is has hardly made any ground since March this year. This does signal to me that buyers of the USD are having a hard time pushing it higher at this point.

So for me, these things do possibly tell me a bottom could be coming in the next 1-3 months. I'm not a fortune teller though so I could be completely wrong. If things play out in an ideal fashion, it should equate to strength coming into the US economy and the market.

My Focus

Currently we are hanging around the 1252 area in the overnight market. I get the feeling we could see a gap beneath the 1250 area at the open. If that is the case, then I would look for some weakness to hit the market if we reach the 1251 area.

If we meet the 1257.50 area I would also be looking for some possible weakness to be shown through the Tick and Volume. It is a messy area in between 1251 and 1257 though so I'm not crazy about a trade there. Again I will only be testing the long side once we pass the 1263 area for the moment. Unless of course we get a strong extreme selling reading at a support level beneath there.

I am sticking with the trades only at s/r levels as they are working well for me. I am continuing my casual approach to my trading as it is loosening me up a bit. I was more relaxed last week with my trading which was good to see. I converted across to the live account with my short trades well. The Wednesday was a bit rough but some good lessons were learnt.

I am keeping the stops tight and initial targets will be in easy to reach places. The second position is trailed if the first target is met.

Daily Signals on 29th July 2008

EUR/USD Analysis


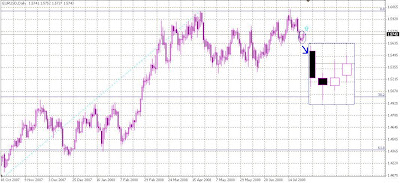
Based on this daily chart, we can see we already have a signal to buy because there are " 3 outside up" pattern but based on this 4H chart


we can see there are a resistance, so I think it's better to wait it break that resistance (1.5757)


Forecast


Day Trader : -

Swing Trader : Up


Recommendation


Day Trader : wait until it break 1.5757

Swing Trader : Buy but it's better to wait until it break 1.5757


USD/CHF


Analysis


Based on this daily chart, we have a good signal. it's already rebound from our channel resistance line. So I think it'll go down.


Forecast :


Day Trader : Down

Swing Trader : Down


Recommendations


Day Trader : Sell

Swing Trader : Sell


That's all. Happy Trading